Odor
Transmission
Melinda Cseh1,
Katalin F. Nárai2,
Endre Barcs3, Dezso Szepesi4
1csehmeli@hotmail.com
2feketenarai@t-online.hu
3bandi@deudi.hu
4modellezopont@levegeokornyezet.hu
Abstract-ODOR
TRANSMISSION is a regulatory model to estimate setback distance on virtual map.
It was prepared by interdisciplinary team of experts. The dispersion part is
based on the former results published in Development of
regulatory transmission modeling in Hungary (Időjárás,
2005), the odor emission part is taken mostly from US results. An estimated
setback distance is presented on virtual map. The model is part of the EIONET
which is the model catalogue of the European Union.
Key-words: odor,
odor unit, transmission modeling, setback distance, exceedance probability
1. Introduction
In the last
decades odor nuisance of livestock units has become more frequent and intensive
in our environment. The fundamental human right requires the pure, livable
environment, which includes the odorless air as well. To find solutions against
odor problems, standard regulations must be done. This involves the need of the
determination of setback distances around animal production farms, municipal
solid waste landfills, wastewater treatment plants and factories that emit
odorous gaseous. Most of the existing setback guidelines were determined either
by individual judgment and experience or by a combination of neighbor surveys
and odor measurements, instead of calculations of dispersion models (Guo et
al., 2004). The determination of odor nuisance by olfactometria (the testing and measurement of the sensitivity of the
sense of smell) is essential, although it contains many subjective
factors. Therefore it is essential to establish a science based model to
predict the setback distances more objective, which can become an effective
practice for the experiments as well as for the regulatory agencies and
decision-makers. The aim of this study is to present the newly developed
ODOR-TRANSMISSION model for odor setback distance determination. The model is
based on the Transzmisszió 1.1 (in EIONET called HNS-TRANSMISSION) softver and
data system, which is used in the Hungarian regulatory system. Both models have
been enrolled in the Model Documentation System of EIONET (ODOR-TRANSMISSION: http://pandora.meng.auth.gr/mds/showlong.php?id=179,
HNS-TRANSMISSION:http://pandora.meng.auth.gr/mds/showlong.php?id=48).
2. Estimation of
odor source term
2.1. Odor
Odor is the
property of a chemical substance or substance mixtures, dependent on the
concentration, to activate the sense of smell and thus being able to start an
odor sensation (Winneke, 1994). As odor sensitivity is differ in each
person, a completely objective and analytical measurement cannot be done,
however it is possible to define the annoyance level of the odorant by several
methodology.
To measure odor
olfactometry methodology is used which based on a panel of human noses as
sensors. For the determination of the quantity of odorants odor concentration
is used, which dimension is European odor unit per m3 (OUE/m3).
The European odor unit by definition is: That amount of odorant(s) that, when
evaporated into one cubic meter of neutral gas at standard conditions, elicits
a physiological response from a panel (detection threshold) equivalent to that
elicited by one European Reference Odor Mass (EROM), evaporated in one cubic
meter of neutral gas at standard conditions. (CEN TC264 Draft). Where European
Reference Odor Mass (EROM): The accepted reference value for the European odor
unit, equal to a defined mass of a certified reference material. One EROM is
equivalent to 123mg n-butanol (CAS 71-36-3) evaporated in one cubic meter of
neutral gas. This produces a concentration of 0.040 mmol/mol. (CEN TC264 Draft).
The above
mentioned olfactometric measurements are needed to determine a reference scale
for each odorant. However for the everyday regulation system these processes
are too complicated and require plenty of time. Therefore, more effective and
straightforward techniques should be used, that can be achieved by building
models based on the results of analytical measures. This is the aim of the
ODOR-TRANSMISSION program.
2.2.
Odorants and its sources
The
ODOR-TRANSMISSION program is developed for one component odorants emitted from
faculties, livestock operations and municipal waste fills.
The
odor that is detected from a livestock operation is a complex mixture of gases.
Most often the odor is a result of the uncontrolled anaerobic decomposition of
manure. However, feed spoilage can also contribute to the odor. The odor that
is detected by the human nose can be a combination of 60 to 150 different
compounds. Some of the most important types of odor causing compounds are:
volatile fatty acids, mercaptans, esters, carbonyls, aldehydes, alcohols,
ammonia, and amines. The odor strength of these compounds does not combine in
an additive manner. That is, sometimes mixing several of these compounds can
result in reduced odor by dilution of the strongest smelling compounds. In
other instances, the mixture is worse than any of the individual compounds.
Ammonia can create strong odors near a building, but is not a significant
component of odor downwind from an animal production facility because ammonia
is highly volatile and moves upward in the atmosphere quickly where it is
diluted.
2.2.1. Animal farms
To determine the
setback distance around an animal production farm, firstly the odor emission
must be predicted. The presented methodology to calculate the odor emission is
based on other publicized studies, measurements and experiences. The equation
to calculate odor emission is based on the Perdue model, which was developed by Lim et al. (2000) and combines features of Austrian and British setback
guidelines (Schauberger and Piringer, 1997; Williams and Thompson,
1985).
The model takes
into consideration the following parameters: the type of animals, the amount of
animals, the manure removal frequency, the manure dilution factor, the area of
the storage building, the wind speed above the ground, and odor abatement.
The method of
the estimation of odor emission is based on the Livestock Unit. The Livestock
unit (LU) is a unit to compare or aggregate numbers of animals of different
species or categories. Equivalences based on the food requirements of the
animals are defined (European commission).
While the Perdue
model estimates the emission for swine buildings, the currently presented model
has developed the methodology for other livestock units as well (Table 1). The
presented livestock units are based on the field and laboratory measurements of
North Dakota State University, Dickinson Research Extension Center and Minnesota University.
1. Table: Livstock unit of different animals
Animal type |
LU |
Swine |
Swine
heavier than135 kg |
0.400 |
Swine
between 25 - 135 kg |
0.300 |
Swine
under 25 kg |
0.050 |
Beef |
Weaned
cow lighter than 360 kg |
0.750 |
Young
cow between 360 - 405 kg |
0.850 |
Cow
between 405-495 kg with calf |
1.000 |
Cow
between 495-585 kg with calf |
1.150 |
Cow
heavier than 585 kg with calf |
1.250 |
Bull
lighter than 900 kg |
1.500 |
Bull
hevier than 900 kg |
2.000 |
Calf |
0.200 |
Horse |
1.000 |
Lamb |
0.100 |
Sheep |
0.100 |
Chicken |
broiler
(liquid manure system) |
0.033 |
Chicken
heavier than 2,25 kg (dry manure system) |
0.005 |
Chicken
lighter than 2,5 kg (dry manure system) |
0.003 |
Turkey |
|
Turkey heavier than 2,25 kg |
0.018 |
Turkey lighter than 2,5 kg |
0.005 |
Goose |
|
Duck |
0.010 |
Concerning the outdoor manure system, an empirical
equation is used according to the studies of J. Herber et al. (2002). It
considers the area of the storage system and the wind speed above the ground.
After calculating the emission for each subsystem of the animal production
farm, the results must be summarized for the final quantification.
2.2.2. Municipal solid waste landfills
Odor emission
calculation for municipal solid landfills is based on Italian studies (Selena
et al., 2005). For the determination of emitted amount of odor the
following parameters (Table 2) have to be taken into consideration: (1) the
annual waste acceptance, (2) the waste density, (3) the working days in one
year, (4) the height of the daily deposited waste layer, (5) the surface of the
active parcels and (6) the surface of the restored parcels.
2. Table: Required data and their dimension for odor
emission calculation of municipal solid landfills
Data |
Dimension |
Annual
waste acceptance |
t/yr |
Waste
density |
t/m3 |
working
days |
d/yr |
height
of daily deposited waste layer |
m/d |
surface
of active parcel |
m2 |
surface
of the restored parcels |
m2 |
The result of the emission model in all case (animal
production farms, manure storage systems, municipal solid waste landfills) is
given in odor unit/second. Odor unit (OU) in this paper is equal to the
European Odor Unit (OUE), which was defined above. The OU/s later on
must be converted into the measure of kg/h for the further processes in
HNS-TRANSMISSION.
3. Atmospheric
dispersion
The dispersion part of the model
is calculated by HNS-TRANSMISSION (Szepesi et al., 2005), which is
well-known and common used softer in the Hungarian air quality protection
regulation. The softver considers meteorological parameters (wind direction,
atmospheric stability categories) and has database for the whole area of Hungary. In addition, this database can be enlarged if the meteorological data are
available from the given territory. Therefore the model can be used not only
for Hungary, but for other countries, places as well. With given input data,
the program determines the concentration of given pollutants against the
distance. Concerning odor nuisance modeling the required data are the following:
the coordinates of the livestock sites (EOV coordinates), the odor emission
(discussed above), and the outcoming air features (temperature, rate of flow).
Based on these parameters, odor concentration against the distance is
determinable around the site by the softver.
HSN-TRANSMISSION model applies the Gaussian
model of diffusion. It is the most widely used model for plume dispersion. Its
most attractive feature is that it fits what we see and experience in the real
world for a range of conditions. In addition, the mathematics of the model is
fairly straightforward. On the other hand, Gaussian models need significant
empirical input to be used for practicable dispersion estimates, making the
model results highly dependent on the conditions of the sampling used to derive
the empirical values.
Similar to the decision process used to
select the appropriate model for regulatory purposes, the selection of the
appropriate dispersion model for odor assessment starts with the source type
and release scenario. In general, most sources can be categorized as point,
area, or volume sources, with continuous or instantaneous releases. The sources
responsible for odor complaints are generally continuous sources, such as from
stacks, scrubbers, or basins; although routine but instantaneous or very
short-term releases (for example, from digester pressure release valves) can
also pose problems at nearby receptors. Depending upon the rate of release
relative to odor perception's short time frame, intermittent sources can be classified
as either continuous sources (release rate on the order of minutes or longer),
or instantaneous sources (release rate on the order of seconds).
The model determines
the number of exceedances against distance in each wind direction. The
calculation requires the determination of the threshold limit for odorants. In
European countries the applied threshold limit is differ from 3 to 10 odor
unit/m3 (Table 3). Concerning sensitivity studies the suggestion of
air quality consultants for odor threshold limit for Hungary is between 3 and 5
odor unit/m3. The exact value must be determined by local
authorities.
Based on the
number of exceedances, the setback distance around the virtual emitting point
in each wind direction can be calculated. The setback distance represents the
area where odor nuisance appears more frequently than it is allowed according
to the percentage of the hours of a year. Therefore, for example in the area,
where 1% the exceedance probability; odor nuisance appears in 88 hours per year.
To develop a standard modeling system this exceedance probability must be
determined by the authorities based on further studies. In international aspect
the most recently used value is 2%, which means that odor nuisance occurs in
176 hours per year.
3. Table: Odor threshold limit in European countries
(Ritvay, Kovács, 2006)
Country |
Odor threshold
limit (OU/m3) |
Denmark |
5-10 |
The
Netherlands |
5 |
Ireland |
3 or 6 |
Norway |
5-10 |
Hungary (suggestion) |
3-5 |
4. Presentation
of setback distance on virtual map
The
ODOR-TRANSMISSION model plots the setback distance on G-map with accuracy of
plus minus 1 meter. In order to define the setback distance accurately, the units
of the animal farm must be evaluated. Based on it, the center which is taken as
the virtual emitting point is defined. The longitude and latitude coordinates
of this point is the base of the plotting system. The setback distance is
measured from this point. Plotting the setback distance in the 16 wind
directions the odor impact zone is well given on the map (Figure 1).
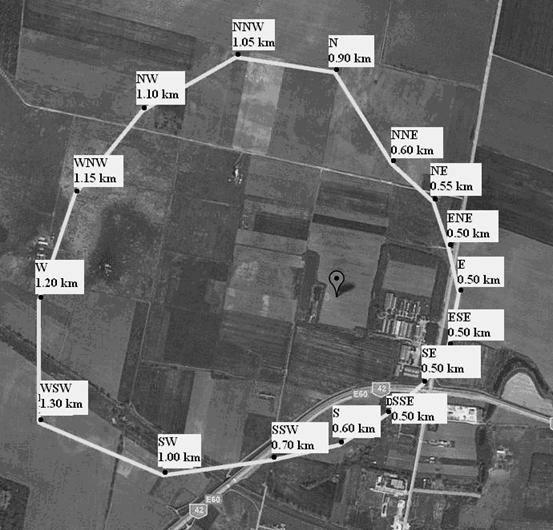
1. Figure: Visualization on Google map of the setback
distance around an animal farm. The distance is measured from the virtual
emitting point in 16 wind directions.
The final visualization
is a helpful tool for decision makers as the impact zone is well determined
with an accuracy of plus/minus one meter, well visible furthermore the mode of
the map can be switch from normal map to satellite and vice versa.
5. Case study
A case study was
made to calculate odor emission from a municipal solid waste landfill in
Dunakeszi. The parameters of the landfill are given in Table 4.
4. Table: Input and output data for odor emission
calculation for municipal solid waste landfill in Dunakeszi.
Input
Data |
|
Annual
waste acceptance |
200000
t/yr |
Waste
density |
0.6
t/m3 |
working
days |
300
d/yr |
height
of daily deposited waste layer |
3
m/d |
surface
of active parcels |
3000
m2 |
surface
of the restored parcels |
22000
m2 |
Output Data |
|
Emission from
the daily deposited waste layer |
21852 OU/s |
Emission from
active parcels |
24000 OU/s |
Emission from
restored parcels |
88000 OU/s |
Total odor
emission (OU/s) |
133852 OU/s |
Total odor
emission (kg/h) |
0.48186 kg/h |
The required
meteorological parameters for the calculation of dispersion are given in the
database of HNS-TRANSMISSION in the file called Vac1.
The output of
the emission calculation is presented in Table 4. The total odor emission is
determined both in the dimension of OU/s and kg/h. The latter dimension is
required as it is the input data for HNS-TRANSMISSION to calculate odor
dispersion. Based on the odor emission the frequency of odor exceedances is
calculated with this Gaussian dispersion model. From the analysis of the
frequency of exceedances against the hours of a year the resulted setback
distance is plotted on Google map around the emitting point in the function of
distance in the 16 wind directions (Figure 2).
2. Figure: Odor setback distance in 16 wind directions
around a municipal solid waste landfill in Dunakeszi.
6. Testing and
validation
For the
validation the ODOR-TRANSMISSION model was compared to three international odor
models (Guo et al., 2004). For the comparison the results of an earlier
study called Comparison of five models for setback distance determination from
livestock sites (Guo et al., 2004) was used.
In this research
odor setback distance calculations were made for 12 American swine farms. The
calculations were made by 5 different models: Ontario MDS-II model, W-T Model,
Austrian Model, Purdue model, Minnesota OFFSET model. The first four model
based on empirical principles, while OFFSET model is calculating with the
dispersion model.
The livestock
facilities were located in the surroundings of Minnesota. The sizes of the
swine farms were different and the type and amount of animals differed as well
(Table 5).
5. Table: Parameters of the 12 livestock operation
farms (Guo et al., 2004)
Farm |
Animal |
Odor source |
Building (m2) |
Outside manure
storage |
1 |
960 nursery to
finishing |
4 barns (735) |
None |
2 |
1720 finishing |
2 barns (1637) |
None |
3 |
2500
nursery/finishing |
7 barns (2725) |
None |
4 |
750 sows |
2 barns (1869) |
1 lagoon
(91*91 m) |
5 |
600 sows, 2500
nursery/finishing |
6 barns (3450) |
1 earthen
basin (31*38 m) |
6 |
1300 sows,
4000 nursery |
3 barns (4167) |
2 earthen
basins
(58*58 m,
58*61 m) |
7 |
2000 nursery,
1000 sows |
3 barns (3534) |
1 earthen
basin (61*61 m) |
8 |
1300 sows
farrowing to weanling |
3 barns (3348) |
2 earthen
basins
(61*48 m,
61*61 m) |
9 |
1400 sows,
2800 nursery |
4 barns (4508) |
2 earthen
basins
(48*48 m,
48*76 m) |
10 |
2400 sows
farrowing to weanling |
3 barns (6882) |
1 tank (1116 m2),
1 basin (61*76
m) |
11 |
4600 sows
farrowing to weanling |
6 barns
(13020) |
2 tanks (1116 m2),
1 basin
(61*122 m) |
12 |
3500 nursery,
3500 finisher |
5 barns (4185) |
2 earthen
basins
(61*152 m,
61*203 m) |
Based on the
given data concerning farm size, animal types, outdoor manure storage and
meteorological parameters; odor setback distances were calculated by the newly
developed ODOR-TRANSMISSION program as well, and were compared to the given
results (Guo et al., 2004). The correlations are shown in Figure 3.
The graphs show
that how much is the setback distance, considering the time of nuisance per
year. The given percentages stand for the number of hours per year, when odor
is annoyance. In each animal farm the maximum setback distance is shown.
Considering the
Offset model (Figure 3a), which also uses air dispersion model for the setback
distance determination, the 2, 3 and 4% exceedance probabilities show good
correlations with ODOR-TRANSMISSION model, while in the case of Purdue model
(Figure 2b) it is 3, 4 and 5% of exceedance probabilities, where the results
correlate well. In general the best fit can be seen with the W-T model (Figure
3c) in the case of 2% exceedance probability.
3.
Figure: Comparison of
ODOR-TRANSMISSION (OT) model with a) Offset model, b) Purdue model, c) W-T
model. Odor setback distance is plotted for the 12 animal farms considering
different exceedances frequencies (the numbers (percentages) refers to the exceedance
frequencies against the hours of one year).
Control
calculations were made for ODOR-TRANSMISSION model by two Hungarian
environmental inspectors Tibor Paksa and Tibor Nagy Ph.D. Both of them find the
model satisfactory and suggested for further application in practice.
7. Sensitivity
Study
A sensitivity
study was made in order to compare the setback distance in the function of the
animal type, number of animals and the threshold limit. The study was made for
city Kecskemét and the exceedances probability was considered 2%. Firstly
calculations were made for chicken, beef and duck. In all case two cases were
considered according to the number of animals. The results show (Table 6) that
if the number of animals is doubled, the setback distance grows but not in the
proportion of the changes of animal number.
Considering
different threshold limit (3 OU/m3, 4 OU/m3, 5OU/m3)
the setback distance is inversely proportional to the threshold limit.
6. Table: Sensitivity analysis in a livestock
production farm in Kecskemét. Odor emission is studied in the functions of
animal type and animal number. Setback distance is analyzed in the function of
threshold limit.
Animal |
Number
of animals |
Odor
emission |
Setback
distance (m) in the function of threshold limit |
OU/m3 |
Kg/h |
3
OU/m3 |
4
OU/m3 |
5
OU/m3 |
Chicken |
100000 |
107100 |
0.38 |
600 |
500 |
450 |
200000 |
214200 |
0.77 |
950 |
850 |
700 |
Beef |
2000 |
74520 |
0.27 |
500 |
400 |
350 |
4000 |
149040 |
0.55 |
800 |
650 |
550 |
Duck |
100000 |
32400 |
0.12 |
250 |
200 |
150 |
200000 |
64800 |
0.24 |
450 |
350 |
300 |
The setback
distance was also compared for a swine farm containing 10000 swine in the
function of the threshold limit. The change of the setback distance was studied
for 3, 4 and 5 OU/m3. The figures (Figure 4, 5, 6) show well that if
the threshold limit increases, the setback distance decreases. In the case of
3 OU/m3, the maximum setback distance from the emitting point is 1.75 km (Figure 4). This value is 1.5 km if the threshold limit is taken as 4 OU/m3 (Figure
5), while for 5 OU/m3, the setback distance is just 1.3 km (Figure 6).
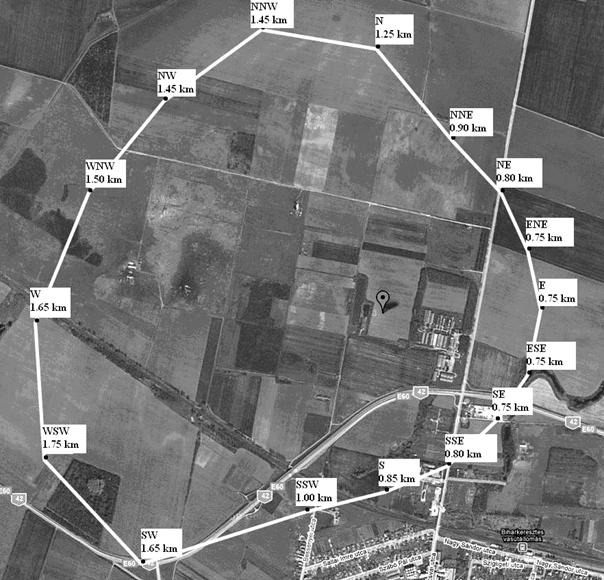
4. Figure: Setback distance in the 16 wind directions
around a swine farm (10000 swine) in the case of 3 OU/m3 threshold
limit. The maximum setback distance is 1.75 km.
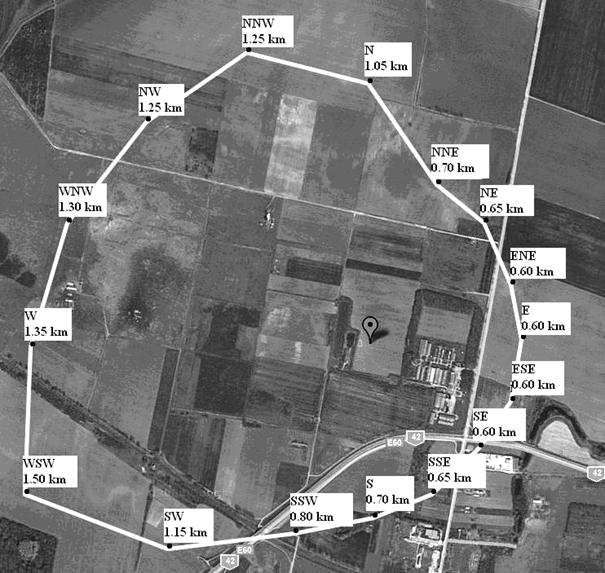
5. Figure: Setback distance in the 16 wind directions
around a swine farm (10000 swine) in the case of 4 OU/m3 threshold
limit. The maximum setback distance is 1.50 km.
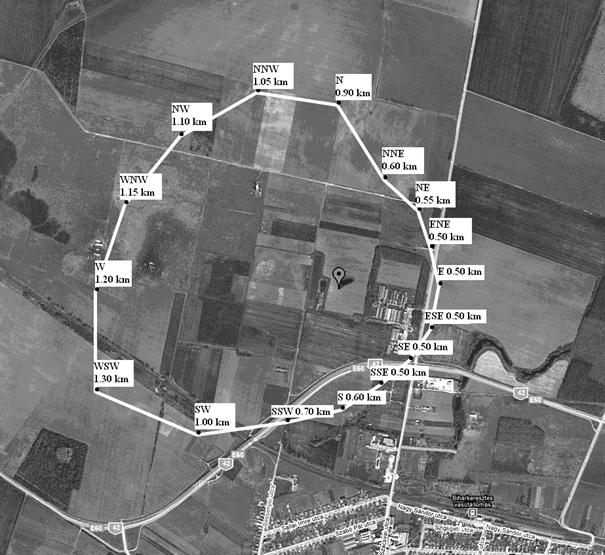
6. Figure: Setback distance in the 16 wind directions
around a swine farm (10000 swine) in the case of 5 OU/m3 threshold
limit. The maximum setback distance is 1.30 km.
8. Conclusions
ODOR-TRANSMISSION
is an objective method to determine setback distance around odor emission. The
use of the program is quite straightforward; it does not require any special
skills. If the input data are correctly given, than odor annoyance can be
determined quantitatively and in a standardized way. The results of the
calculation can help both decision makers and adepts in controlling, planning
or decision making as well.
References
Commission International du Génie Rural (CIGR), 1994: Aerial environment in animal housing- concentration in and
emission from farm buildings. CEMAGREF, Rennes.
Chastain, J.P., 1999: Air Quality and
Odor Control from Swine Production Facilities. Chapter 9 in Confined Animal Manure Managers Certification Program Manual, Clemson University, Clemson
SC, pp 9-1 to 9-11.
Department of Environmental Protection,
2002: Odour Methodology Guideline, Perth
ECN/ORBIT
e.V., Odour Management Workshop 2003: Odour definition, Odour measuring and Odour
generation
Environmental
Protection Agency, 2004: Queesland goverment, Odour
Impact Assessment for Developments
European Standard, 2003: Air quality -
Determination of odour concentration by dynamic olfactometry EN 13725:2003 E
European Topic
Centre on Air and Climate Change (EIONET):
ODOR-TRANSMISSION http://pandora.meng.auth.gr/mds/showlong.php?id=179
HNS-TRANSMISSION
http://pandora.meng.auth.gr/mds/showlong.php?id=48
D.
Ritvay, D. Kovács, 2006: A bűzkibocsátás szabályozásának
nemzetközi és hazai gyakorlata, National Environmental Conference, Siófok, Conference
Publication, pp 69. (in Hungarian).
du Toit, A.J.: 1989. Practical odour
nuisance gauging: two case studies of objective odour qualification in
agriculture and industry. Water Science Technology 21, 1077-1087.
Gassman. 1992. Simulation of Odor
Transport: A Review. ASAE Paper No. 92-4517, ASAE, 2950 Niles Rd., St.
Joseph, MI 49085-9659.
H.
Guo, L.D. Jacobson, D.R. Schmidt, R.E. Nicolai and K.A. Janni,
2004 Comparison of five models for setback distance determination from
livestock sites, Canadian Biosystems Engineering 46, 6.17-6.25.
J.
Heber, J.–Q. Ni, T. T. Lim, 2002: Odor flux measurements at a
facultative swine lagoon stratified by surface aeration, Applied
Engineering in Agriculture, 18(5), 593-602
Levegőkörnyezet Bt.: www.levegokornyezet.hu
Lim,
Teng Teeh; Heber, Albert J.; Ni, Ji-Qin; Grant, Richard; Sutton, Alan L., 2000:
Odor impact distance guideline for swine production systems, Water
Environment Federation, Odors and VOC Emissions 2000, pp.
773-788(16)
Llewellyn
L. Manske PhD, 1998: Animal unit equivalent for beef cattle based
on metabolic weight, Research Report, North Dakota State University, Dickinson
Research Extension Center
Minnesota
Department of Agriculture: The Minnesota Livestock Producer’s Feedlot Planning
and Operations Manual.
Petzer, G., H. Liebenberg-Enslin Planning
Professionals (Pty) Ltd, Halfway House, 1685:
Assesment and management of odour in South Africa using odour performance
criteria.
Dezső Szepesi, Katalin Fekete, Richárd Büki,, László
Koncsos and Endre Kovács, 2005: Development of regulatory transmission modeling in Hungary, Időjárás, 109, pp 257-279.
Selena
Sironi, Laura Capelli, Paolo Céntola, Renato DelRosso, Massimiliano Il Grande, 2005: Odour
emission factors for assessment and prediction of Italian MSW landfills odour
impact, Atmospheric
Environment 39., 5387–5394.
Schauberger, G., Piringer, M. and Petz E. 2000: Diurnal and annual variation of the sensation distance of
odour emitted by livestock buildings calculated by the Austrian odour
dispersion model (AODM), Atmospheric Environment 34., 4839-4851.
Smith, R.J. and P.J. Watts, 1994: Determination of Odour Emission Rates from Cattle Feedlots: Part 1, A Review. J. Agricultural Engineering Research, Silsoe Research Institute, Silsoe, England, 57:145-155.
Teng-Teeh
Lim, Albert J. Heber, Ji-Qin Ni, Alan L. Sutton, and Ping Shao, 2003: Atmospheric Pollutants and Trace Gases - Odor and Gas Release from Anaerobic
Treatment Lagoons for Swine Manure, Technical Report, Journal of
Environmental Quality 32., 406-416
Van
Harreveld, A., Ph, OdourNet: Odor Regulation and the History of
Odor Measurement in Europe.
Winneke
G. and Steinheider B., 1994: Exposure-response associations
between environmental odours, traffic noise, annoyance and somatic complaints.
In Gesellschaft für Hygiene und Umweltmedizin/ Medizinisches Institut für
Umwelthygiene an der Heinrich-Heine-Universität Düsseldorf (Hrsg.), Umwelthygiene
- Supplement 2. 1st Internationaler Kogress für Umweltmedizin, pp. 87-89.
Williams, M.L.
and N. Thompson, 1985: The effects of weather on odour dispersion from livestock buildings and
from fields, In: Odor Prevention and Control or Organic Sludge and Livestock
Farming, Ed: V.C. Nielsen, J.H. Voorburg, and P.L'Hermite. Elsevier
Applied Science Publishers, New York, Pp. 227-233
Yanan
Xing,
2006: Evaluation of commercial air dispersion models for livestock odor
dispersion simulation, Master thesis, University of Saskatchewan, Department of Agricultural and Bioresource Engineering, Saskatoon.